Worldline releases its India Digital Payments Report for H2 2023
Mumbai, India — 04 / 04 / 2024
Mumbai, 03 April 2024 – Worldline (Euronext: WLN), a global leader in payment services, today unveils its India Digital Payments Report for H2 2023 (July to December 2023) which captures a series of noteworthy trends and shifts within the digital payments landscape. The report reveals that UPI remains dominant in the payment system and is rapidly expanding its reach beyond India.
- UPI transaction volume witnesses a staggering growth of 56% YoY.
- A total number of cards recorded a 6% YoY growth standing at 1.384 billion H2 2023.
The report cited that the number of UPI transactions has seen a significant uptrend in H2 2023 growing at 56% YoY with the volume being at 65.77 billion from 42.09 billion in H2 2022, while the value of transactions during the same time frame surged by 44% from INR 69.36 trillion to INR 99.68 trillion.
The noteworthy figure remains the average ticket size (ATS), which declined by 8% from INR 1648 to INR 1515. The ATS persistently follows a downward trend, indicating a more profound integration of UPI, particularly in smaller or micro-transactions. This decline is predominantly propelled by the surge in person-to-merchant (P2M) transactions.
Ramesh Narasimhan, Chief Executive Officer - India, Worldline, said, “The year 2023 witnessed some significant milestones in the payments ecosystem. UPI maintains its position as the uncontested frontrunner, buoyed by substantial expansion in mobile transactions. This trend underscores users' growing confidence and familiarity with smartphone-based payment methods. The proliferation of Point of Sale terminals has reached unprecedented levels, concurrent with the ascendance of mobile payments as a dominant transaction avenue. This underscores the necessity for FinTechs to adjust to a diverse array of payment channels”.
Some of the key findings
A. Payments Acceptance Infrastructure
Between July 2022 and December 2023, there was a notable increase in the payment acceptance infrastructure channels. Point of Sale (PoS) terminals expanded by 26% to reach 8.56 million. Private Sector banks dominated the space with a 73% market share while Public Sector Banks accounted for 18%. Payments and foreign banks have 8% and 1% market share respectively. Bharat QR (BQR) usage grew by 32% to 5.96 million. The standout, as expected, is UPI QRs which grew by 57% to 317 million.
P2P and P2M Transactions
UPI transactions consist of person-to-person (P2P) and person-to-merchant (P2M) transactions. While both have clocked good growth numbers, the growth in P2M transactions is particularly remarkable. P2M transactions witnessed a remarkable 77% increase in volume, rising from 21.84 billion in H2 2022 to 38.73 billion in H2 2023, while the value escalated from INR 15.66 trillion H2 2022 to INR 25.43 trillion in H2 2023 marking a growth of 62% YoY. P2P transactions surged from 20.25 billion in H2 2022 to 27.04 billion in H2 2023, marking a 34% YoY increase. Concurrently, the value of P2P transactions grew from INR 53.69 trillion to INR 74.24 trillion, reflecting a 38% increase.
Average Ticket Size
The average ticket size (ATS) of all UPI transactions in H2 2022 was INR 1648 compared to INR 1515 in H2 2023, an 8% decrease. For P2P transactions, the ATS saw a 4% YoY growth from INR 2649 to INR 2745. During the same period, the ATS of P2M transactions decreased from INR 720 to INR 656, representing a 9% drop. This gives a clear indication that the reduction in overall ATS has been driven by P2M transactions which is a good trend as the future of UPI is P2M transactions.
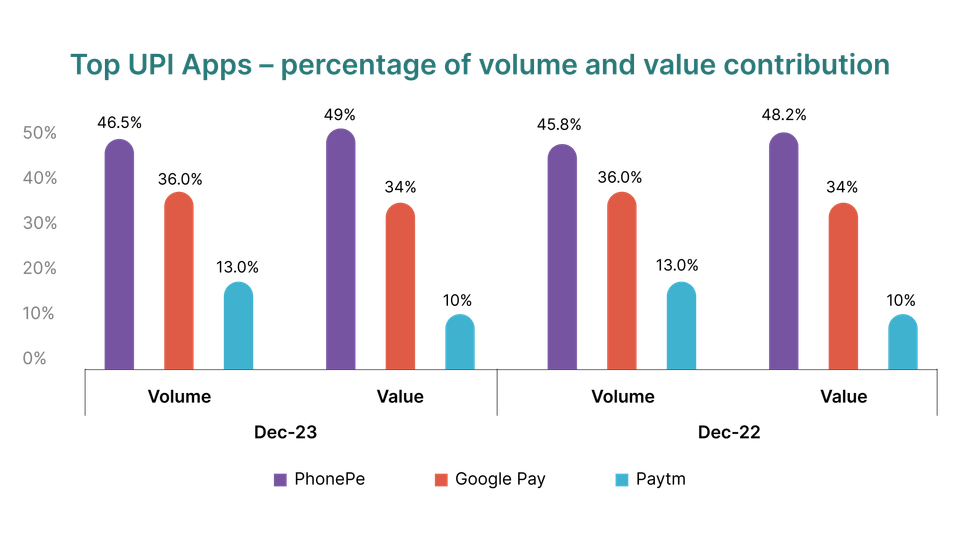
The top 5 remitter and beneficiary banks (in December 2023) are the below and are being driven by PhonePe and Google Pay; Paytm rides on the rails of Paytm Payments Bank rails while the other 2 use the rails of other banks.
| UPI Remitter Banks | Total Volume (In million) |
|---|---|
State Bank Of India | 3073.2 |
HDFC BANK LTD | 1040.8 |
Bank of Baroda | 766.81 |
Union Bank of India | 745.87 |
Punjab National Bank | 607.36 |
(Note: this report is for H2 2023 before the RBI action on Paytm Payments Bank.)
| UPI Beneficiary Banks | Total Volume (In million) |
|---|---|
Paytm Payments Bank | 2835.3 |
Yes Bank Ltd | 2269.5 |
State Bank Of India | 1252.2 |
Axis Bank Ltd. | 967.52 |
ICICI Bank | 647.97 |
B. Credit, Debit and Prepaid cards
The total number of cards in circulation has shown a modest growth in the past year. In December 2023, the total number of cards was 1.384 billion, a 6% YoY increase. Credit cards witnessed the highest upsurge YoY basis with a growth of 21% at 97.9 million. This was followed by Prepaid cards with a YoY growth of 13% at 325 million. Debit cards witnessed a minuscule growth of 2% at 960.8million.
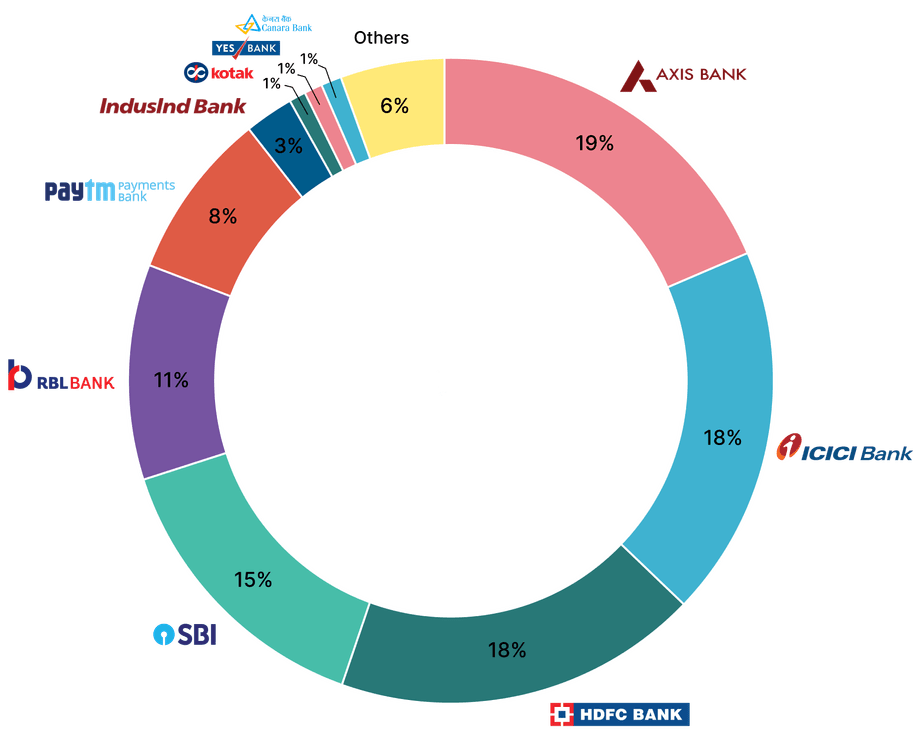
The top 5 issuers of credit cards were HDFC, SBI, ICICI, Axis and Kotak respectively and the top 5 issuers of debit cards were SBI, Bank of Baroda, Canara Bank, Union Bank of India and HDFC Bank. 71% of credit cards were issued by private sector banks and 24% were by public sector banks while 65% of debit cards were issued by public sector banks and 24% by private sector banks. The balance was issued by payment banks, small finance banks and foreign banks. The distinction between private sector banks dominating credit card issuance and public sector banks dominating debit card issuance is clear suggesting the risk appetite among the former is higher while the latter is focused on providing accounts to a larger section of the population including the unbanked.
In contrast to card issuance, the volume of card transactions in H2 2023 declined to 3.70 billion, marking a 7% decrease from H2 2022. This decline was predominantly propelled by debit card transactions, whereas credit card transactions experienced an upswing.
Debit card transactions in H2 2023 were recorded at 1.15 billion witnessing a decline of 34% YoY. Credit Card transactions on the other hand were at 1.78 billion with a YoY upsurge of 21% when compared to H2 2022.
The value of card transactions in H2 2023 was INR 12.66 trillion, an increase of 13% from H2 2022. This growth was largely supported by credit cards. Credit card transactions value in was INR 9.39 trillion, a strong rise of 11% from H2 2022 while, during the same period, debit cards transaction value was INR 3.02 trillion, a fall of 16% and prepaid cards were INR 241 billion, a fall of 30%. Credit card have been consistently on the rise; in H1 2022, credit transactions increased by an impressive 30.5% YoY.
The average ticket size (ATS) for all cards was INR 2742, a 10% YoY increase. This growth was primarily driven by debit card ATS growth. Credit cards ATS in H2 2023 was INR 5276, an 8% growth and prepaid cards ATS was INR 310, a 28% decrease and debit cards ATS was INR 2642, a strong 24% growth. Like the previous half, the growth in debit card ATS suggests that while debit card transaction volume fell, there was still a significant population that used debit cards for their purchases and that ensured that transaction value did not fall parallelly
PoS terminals in H2 2023 recorded a total card transaction volume of 2.18 billion growing at 8% YoY. During this period credit card transactions were 925 million with an impressive growth of 14%, while Debit cards recorded a degrowth of 29% YoY at 828.75 million.
The total value of card transactions in H2 2023 for online purchases surged by 24% to INR 7.34 trillion compared to H2 2022. During the same period, the value of credit card transactions soared by 40% to INR 6.12 trillion, while debit card transactions decreased by 18% to INR 1.03 trillion, and prepaid card transactions dropped by 32% to INR 190 billion. This indicates that UPI transactions are increasingly dominating other channels, both at Point of Sale (PoS) and online. However, credit card expenditures are rising due to heightened consumption of higher-value goods and services
C. Mobile Payments
Mobile payments, which are transactions done using mobile phone apps, have seen solid growth. A significant number of these transactions are UPI-based but could be a whole host of payments using bank accounts etc. The volume of mobile transactions in H2 2023 was 62.95 billion compared to 45.58 billion in H2 2022, a 38% increase while the value of mobile transactions in H2 2023 was INR 152.33 trillion compared to INR 116 trillion in H2 2022, a 31% increase. Another comparison shows the real growth; between January 2023 and December 2023, the volume was up 34% while the value was up 33%.
The ATS of mobile app transactions in H2 2023 was INR 2419.60, a 5% reduction compared to H2 2023. What this shows is how Indians have taken to their mobile phones to make payments for multiple goods and services using multiple channels. The growth in this channel also indicates how stable this method of payment will be and how it will continue to power the future of payments in India.
D. Electronic Toll Collection
Electronic Toll Collection (ETC) has significantly transformed the way tolls are paid on the nation's roads, extending to parking plazas and various other applications. Drivers nationwide can attest to the convenience it brings to road travel, and the consistent uptake of this technology is evident in the data. The number of tags issued has grown from 55.94 million in July 2022 to 81.24 million in December 2023, a 45% growth. In terms of volume, transactions in H2 2023 were 1.89 billion compared to 1.67 billion in H2 2022, a 13% growth while the value of ETC transactions in H2 2023 was INR 319.48 billion, a 20% increase when compared to H2 2022 (INR 267 billion).
Note to editors:
These figures reflect general market trends and should not be taken as a proxy for Worldline‘s market share or company earnings. The figures primarily reflect transactions undertaken from July to December 2023 available in public databases during this period.
About Worldline
Worldline [Euronext: WLN] helps businesses of all shapes and sizes to accelerate their growth journey – quickly, simply, and securely. With advanced payments technology, local expertise and solutions customised for hundreds of markets and industries, Worldline powers the growth of over one million businesses around the world. Worldline generated 4.6 billion euros in revenue in 2023.
In India, Worldline has been building a robust payment ecosystem and a Buland Bharat for over 26 years. Our PayTech offering in India encompasses the entire payment value chain – in-store and online - and is aligned with our commitment to building a less cash economy in India and boosting economic growth. Today, Worldline is acknowledged as one of the foremost PayTech organisations in India and is a preferred partner for 30+ leading public and private sector banks along with NBFCs, Insurance Companies, E-commerce, Start-up, Retail brands and SMBs.
Press Contact